
This is a build write-up, it covers how I process the sensor readings, visualise them in Grafana, and get alerted when a plant needs watering. Part 1 covering the hardware setup can be found here: Monitoring house plants for when they need watering, here I'll go through making use of the readings and sending alerts when a plant needs watering.
Now we’ve got the sensor up and running, taking readings on a regular basis and sending those to a message queue the next step is to receive those messages and do something about them.
Message Processing
Originally I wrote all the readings to a SQLite database and then build a simple UI that rendered a graph, it was templated HTML served by a Go service, the trouble with this was the way I wrote it older readings were never aged off so the graph axis got more and more congested as new readings were rendered. I did alternatively look at using a javascript graphing library to create some nice graphs, however that involved more frontend code than I wanted to write for this project. I’ve since moved on to a simple service written in Go which takes the readings from MQTT and exposes them as Prometheus metrics. These are then read in turn by a collector and sent to Grafana cloud which is free at this scale and lets us create graphs from the readings that are taken, it also has built-in alerting capability so we can be notified when the plants need watering.
The messages we send (and therefore receive) look like this:
{"name": "seedlings", "value": "80.1"}The full code for the service can be found here: https://github.com/CSTDev/soil-moisture-monitoring/tree/main/soil-moisture-exporter
Setting Thresholds
You may notice that the service calls out to a database to find the Threshold for each sensor based on the name in the reading it received. This allows us to create a metric that resolves to a simple true or false when asked, “is the moisture below X” where that value is what I’ve guess-timated is a healthy number for that plant.
This is totally optional as we can just use alert rules in Grafana to specify the value below which to alert us, I’ll come to that later. The case against just using alert rules is as the number of sensors grow we’d have to configure a second datasource to map different thresholds for different sensors.
The threshold is stored in an SQLite database that runs alongside the service that reads the metrics.
SQLite Setup
To create an empty database run:
sqlite3 /data/soilConsumer/config/iot.dbThis opens an interactive shell, we can then create the two tables we need:
CREATE TABLE soilmoisture(timestamp INTEGER, sensorName TEXT, value REAL, PRIMARY KEY(timestamp, sensorName));
CREATE TABLE sensors (id TEXT PRIMARY KEY, threshold int);
To register a sensor and set its moisture threshold (the minimum value before an alert is triggered), insert a row into the sensors table:
INSERT INTO sensors (id, threshold) VALUES ('my-sensor-name', 50);The id must match the name field in the MQTT payload published by the ESP8266.
Metrics
Once the service is running and reading messages from MQTT it exposes metrics that look something like this:
...
# HELP moisture_below_threshold Is the moisture level below the threshold
# TYPE moisture_below_threshold gauge
moisture_below_threshold{sensor="orangeTree"} 0
moisture_below_threshold{sensor="seedlings"} 0
# HELP moisture_percentage Current moisture level
# TYPE moisture_percentage gauge
moisture_percentage{sensor="orangeTree"} 78.61
moisture_percentage{sensor="seedlings"} 68.3
...
These can be scraped by any prometheus compatible scraper. For this project we use the OpenTelemetry Collector, it runs as a separate container alongside the soil moisture exporter and has been configured to read the metrics and send them to Mimir in Grafana Cloud. To setup the OTLP collector follow this How to configure the OpenTelemetry Collector for Grafana Cloud
The UI
The easiest way to get this all visualised with a nice graph is to use Grafana. You can run it locally, but for this project it’s small enough that it falls well within the bounds of their free tier and therefore wasn’t worth setting up a Grafana and supporting services for.
Once you’re in and using Grafana Cloud there are two things you’ll need to find.
- Authentication user/password
- The Prometheus endpoint to send metrics to.
This How To will help you find them if you need: How to configure the OpenTelemetry Collector for Grafana Cloud
Dashboards
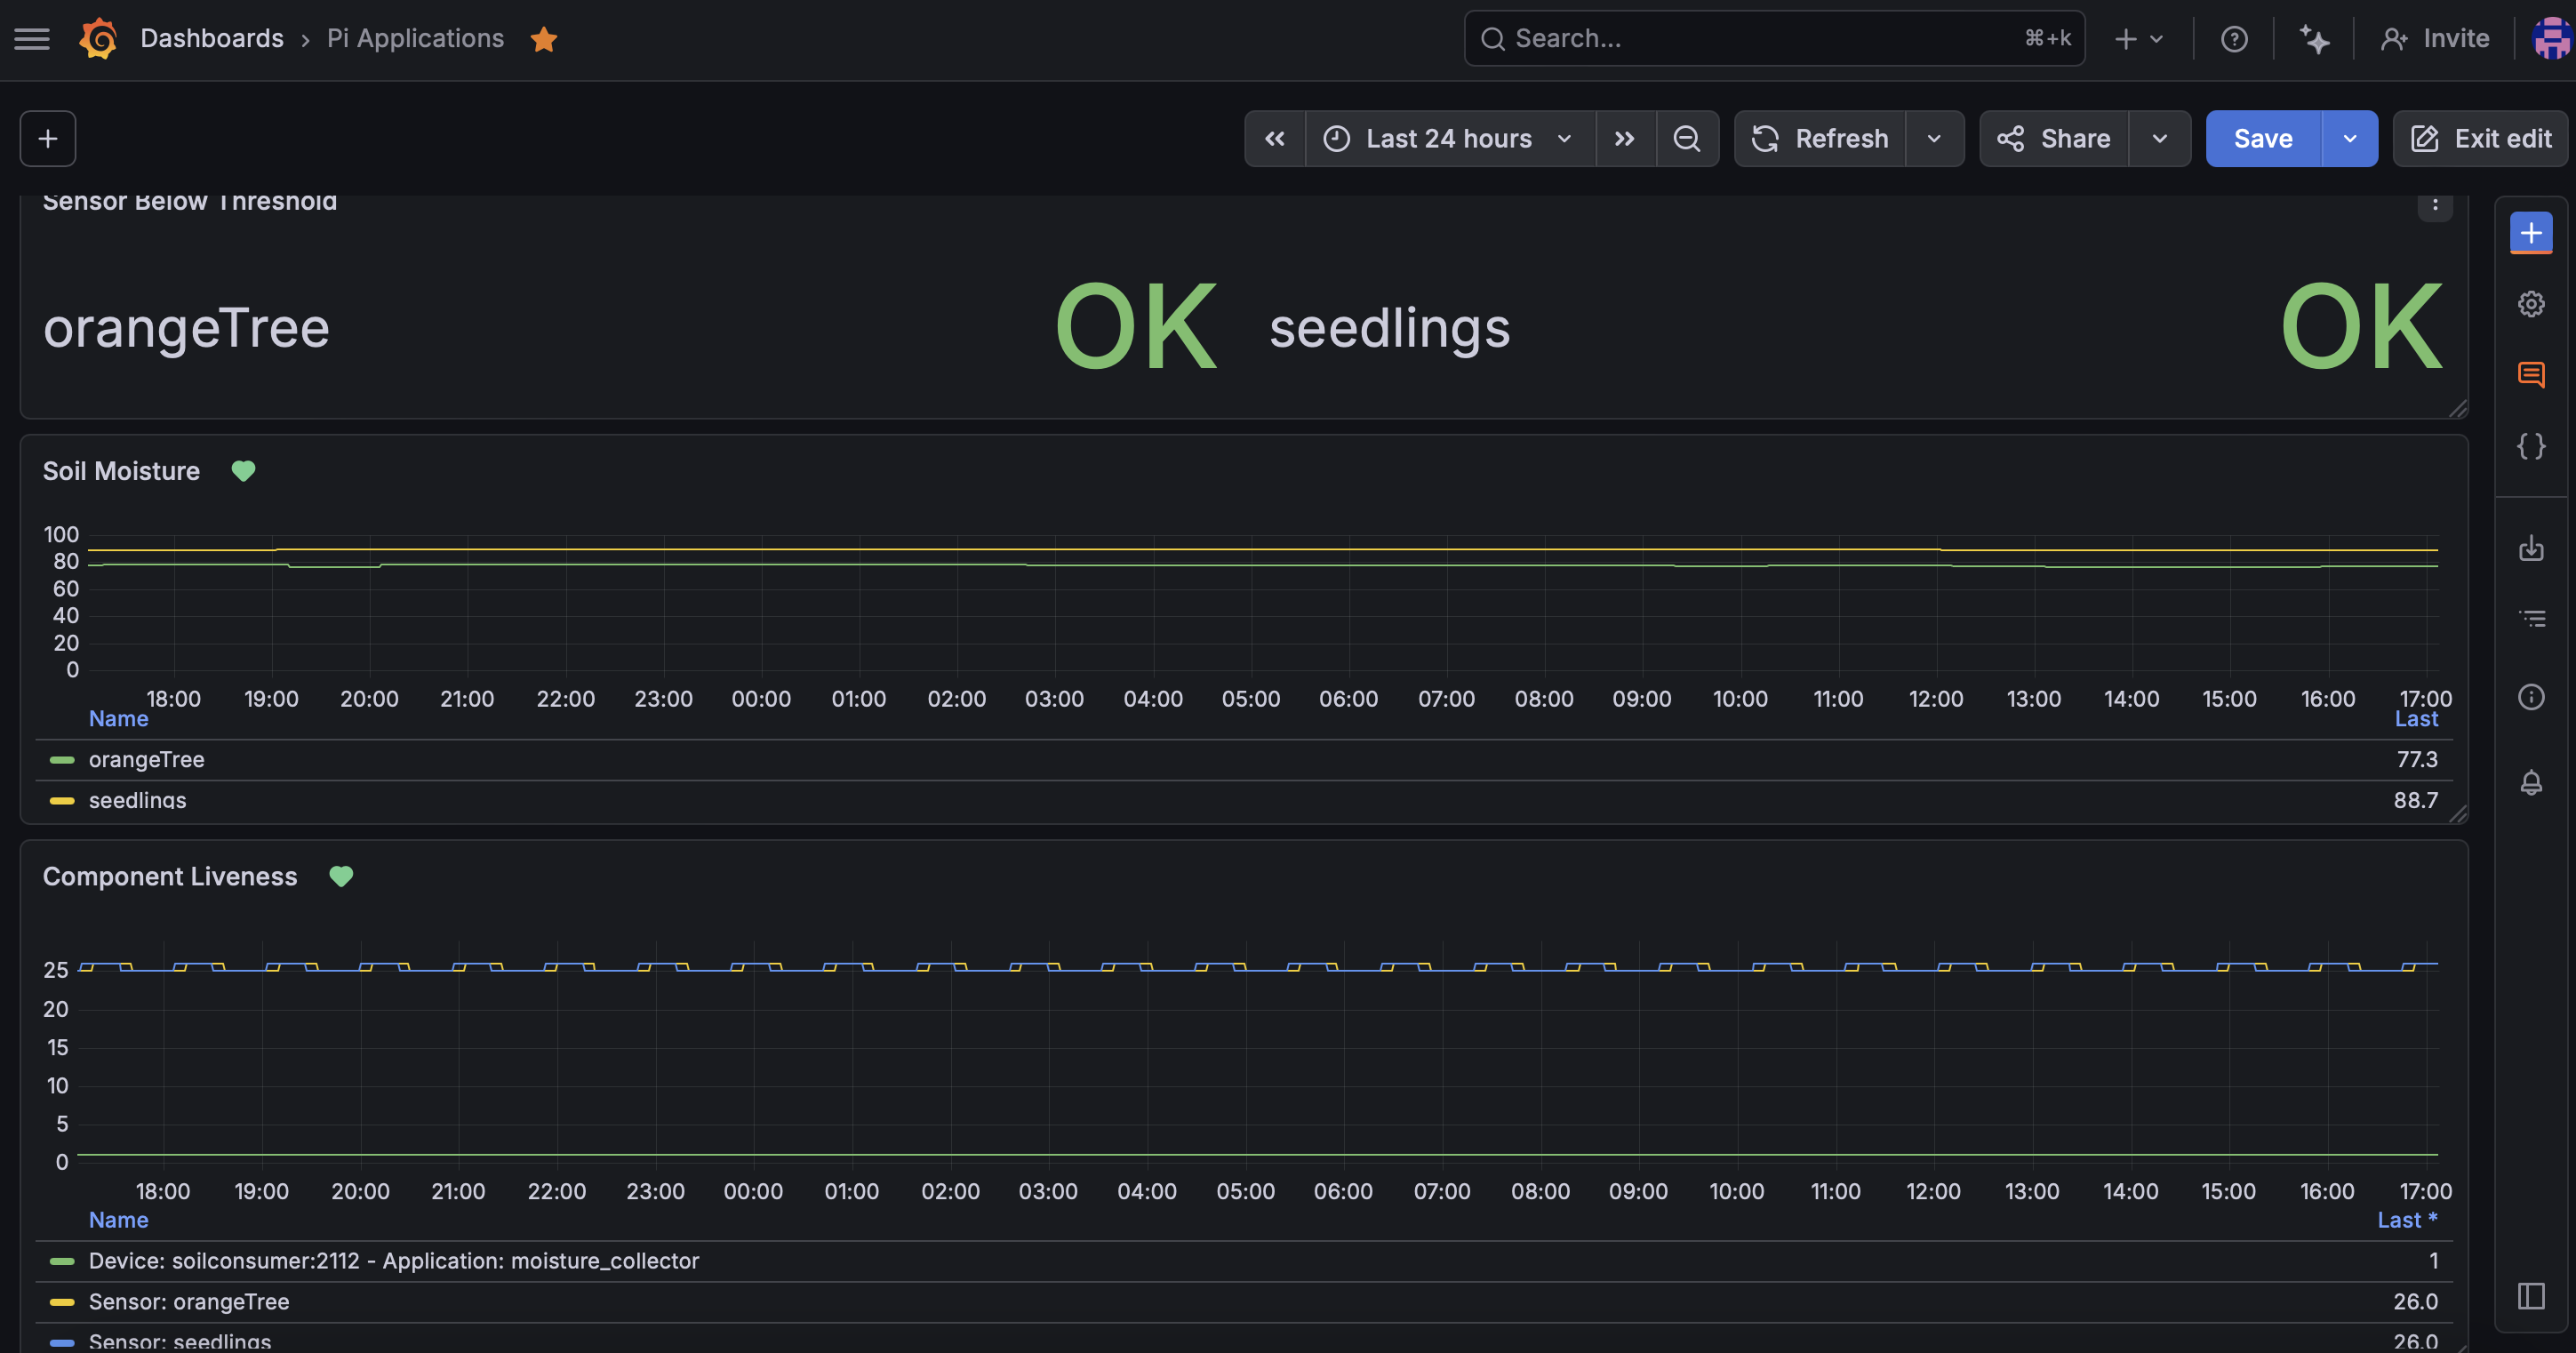
Once you’ve got the credentials you need and the endpoint and have updated your OTLP collector, you’ll start getting metrics into Grafana. Next up is to make some pretty graphs, everyone loves a pretty graph. This dashboard is what I use to monitor the status of the two plants I have all this connected to. It has three panels:
- Sensor Below Threshold - this uses the binary 0/1 value to determine if they’re
OKorDYING - Soil Moisture - a running graph of the last moisture percentage received
- Component Liveness - monitors when the last measurement was received from a sensor, and that the heartbeat from exporter is received
The dashboard is available in the Github repository, so you can just go to Dashboards → New → Import Dashboard.
Alerts
Alerts are created per panel rather than from a blank rule, which pre-fills the query for you. See Grafana's alerting docs for how to go about creating them from the panel. I have four:
- Component Liveness - alert when we lose a sensor or the exporter (two alerts)
- Soil Moisture - A base alert that regardless of the threshold fires when the soil moisture reading is less than this level
- Sensor Below Threshold - Alerts based off the binary value compared to the threshold in the database
Notifications
The last thing to do is to set up a Contact Point which allows us to receive notifications and not need to monitor the dashboard. There are lots of methods that Grafana supports but I just use Email and Slack as they are two methods that I receive notifications for other things and therefore are easily accessible. Set them up via Alerting → Contact Points.
Once you’ve got one of them set up then you can go back to the alerts we configured earlier and set the Contact Point to this email one. Now whenever one fires due to the reading being too low or the sensor or exporter not being available you’ll get a notification to email or slack.
Give it all a go! Put the moisture sensor in a house plant and ensure the ESP8266 is powered, you'll soon see readings start coming in to the Grafana dashboard (it'll take a while if you've got the deep sleep to wake it every 30 minutes mind).
If you want to replicate this, start with Part 1 for the hardware and sensor how-to's, then come back here and follow How to configure the OpenTelemetry Collector for Grafana Cloud to get readings flowing into your dashboard.
Never kill a house plant again! (Unless you now over-water them….)